
Photo: Wikipedia
Austin, TX
Find The Best Places To Live
in Austin
PRO TIP! You can paste a Zillow or Redfin link to get info on that property.
Demographics of Austin, Texas
Quality of Life in Austin, Texas
Above-average quality of iife. The area offers a reasonable cost of living, decent mobility, and a mix of neighborhood amenities.
What does Quality of Life tell us?
Quality of Life blends cost of living, nearby amenities, socioeconomic signals, and neighborhood character. City-level scores represent the whole municipality; individual neighborhoods can differ.
Quality of Life blends cost of living, nearby amenities, socioeconomic signals, and neighborhood character. City-level scores represent the whole municipality; individual neighborhoods can differ.
Cost of Living
58% above national average
The Real Cost of Living in Austin, Texas for 2026
| Tier | Individual | Family (4) |
|---|---|---|
| Survival | $26k | $50k |
| Comfortable | $100k | $146k |
| Luxury | $165k+ | $256k+ |
| Elite (Top 5%) | $218k+ | $338k+ |
62%
The Hood Index™
A metric tracking the socioeconomic signals of the area.
Hobbies
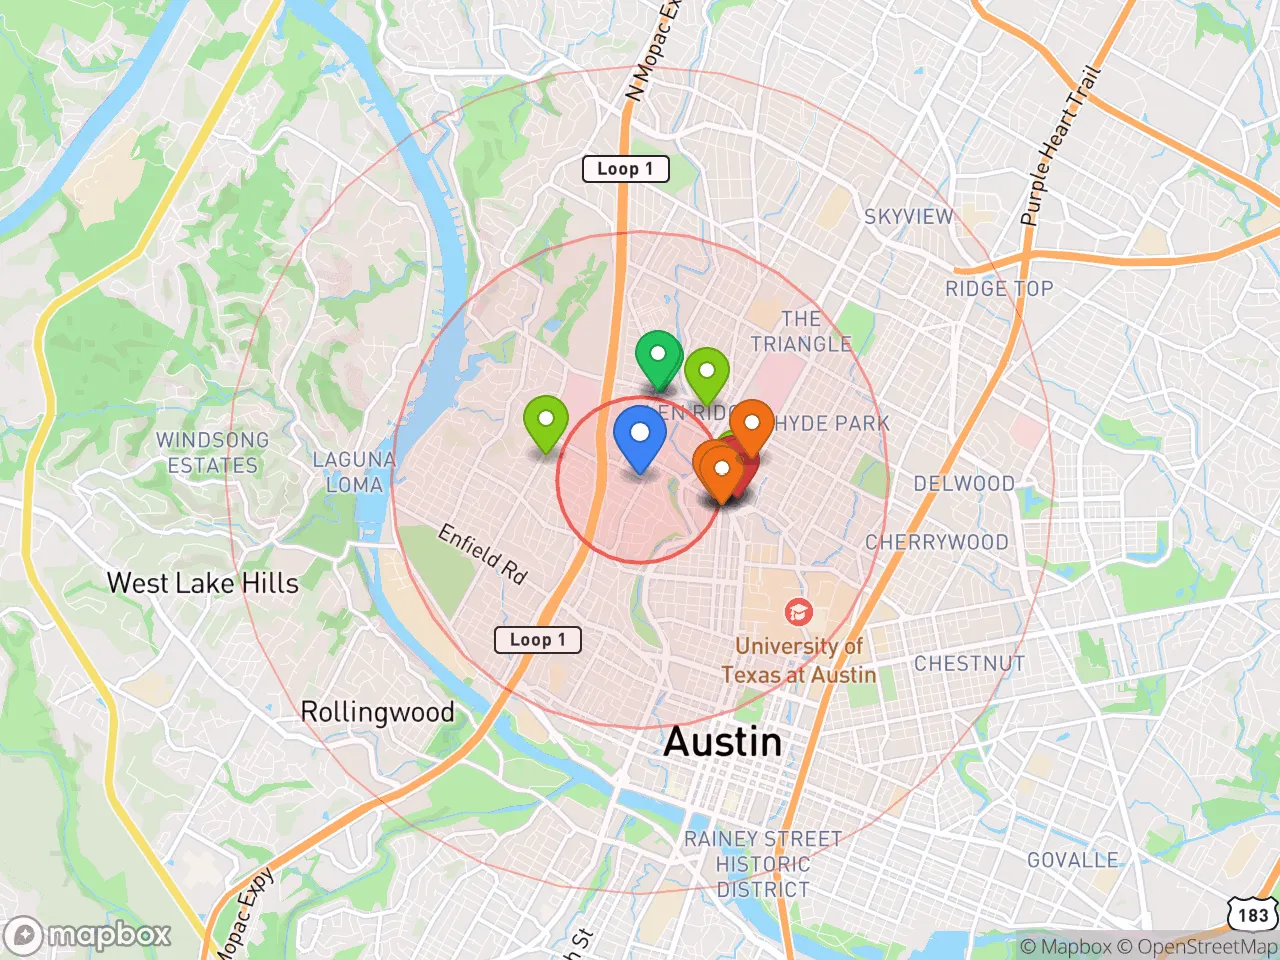
Explore the areaGroceries
7 within 10 miles
Gas
20 within 10 miles
Hospital
20 within 20 miles
Airport
AUS — Austin-Bergstrom International
Post Office
USPS — Austin, TX
Critical Amenities
Affluence Level in Austin, Texas
An upper-middle-class area. Household wealth, education levels, and homeownership run ahead of national benchmarks.
Crime in Austin, Texas
WARNING: The crime statistics are unreliable for this jurisdiction. Local authorities have either not reported or under reported their data to the FBI. This could be due to bad intentions, incompetence or technical issues. Regardless, we suggest skepticism.
Crime rates similar to the national median for U.S. locations.
Violent CrimeViolent Crime Analysis
Property CrimeProperty Crime Analysis
Political Climate in Austin, Texas
District shown is the primary district for this city’s centroid. Cities may span multiple districts.
Personal Sovereignty in Austin, Texas
What does Personal Sovereignty tell us?
Personal Sovereignty measures your capacity for self-reliance and independence with minimal government friction. Higher scores mean fewer barriers between you and the way you want to live... but it assumes you have the space you need and good neighbors.
Personal Sovereignty measures your capacity for self-reliance and independence with minimal government friction. Higher scores mean fewer barriers between you and the way you want to live... but it assumes you have the space you need and good neighbors.
Strong independent fundamentals that actively favor personal liberty and low regulation.
State Policy
Energy independence: Net exporter (220% of energy produced in-state)
Personal Liberty
Homesteading
Strategic Assessment of Austin, Texas
What does the Strategic Assessment tell us?
Strategic Assessment grades tactical survivability using Joel Skousen's Strategic Relocation framework. Major population centers, blast zones, natural disasters, and border exposure all drive risk — lower exposure means a more defensible position in a crisis.
Learn more about Strategic Relocation ($)Strategic Assessment grades tactical survivability using Joel Skousen's Strategic Relocation framework. Major population centers, blast zones, natural disasters, and border exposure all drive risk — lower exposure means a more defensible position in a crisis.
Learn more about Strategic Relocation ($)Multiple tactical vulnerabilities. Population density, target proximity, or disaster risk are likely compounding. A retreat property and exit planning is required.
Strategic Pillars
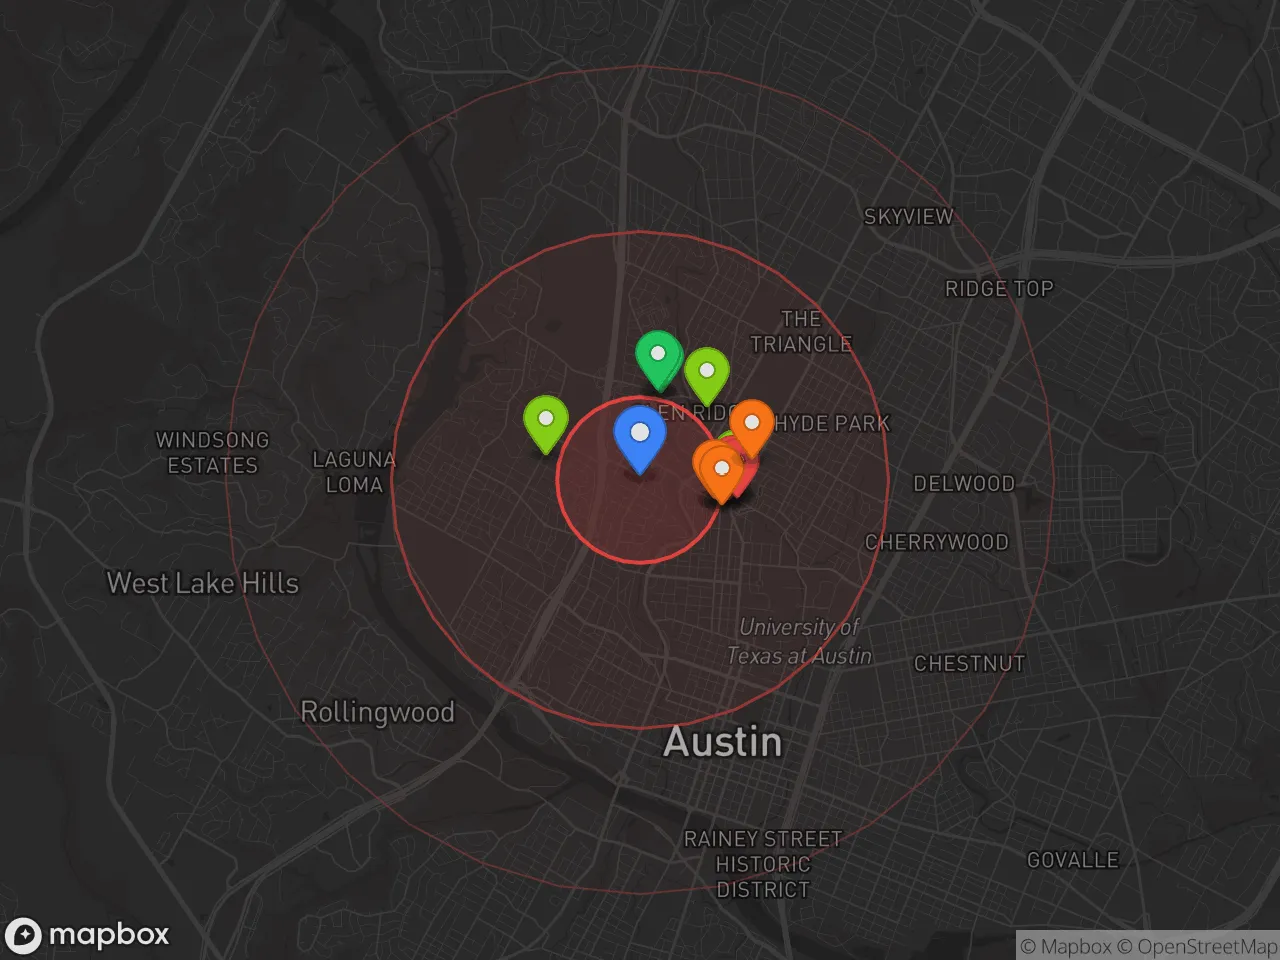
Key Distances
* Values derived from national, state, county, city and local statistics and may differ in a specific area. Last updated: 2026-04-22T01:53:59.000Z