
Photo: Wikipedia
Greenville, NC
Find The Best Places To Live
in Greenville
PRO TIP! You can paste a Zillow or Redfin link to get info on that property.
Demographics of Greenville, North Carolina
Quality of Life in Greenville, North Carolina
A high quality of life with strong walkability, manageable living costs, healthy neighborhood signals, and solid amenity access.
What does Quality of Life tell us?
Quality of Life blends cost of living, nearby amenities, socioeconomic signals, and neighborhood character. City-level scores represent the whole municipality; individual neighborhoods can differ.
Quality of Life blends cost of living, nearby amenities, socioeconomic signals, and neighborhood character. City-level scores represent the whole municipality; individual neighborhoods can differ.
Cost of Living
19% below national average
The Real Cost of Living in Greenville, North Carolina for 2026
| Tier | Individual | Family (4) |
|---|---|---|
| Survival | $16k | $29k |
| Comfortable | $41k | $61k |
| Luxury | $91k+ | $142k+ |
| Elite (Top 5%) | $127k+ | $198k+ |
83%
The Hood Index™
A metric tracking the socioeconomic signals of the area.
Hobbies
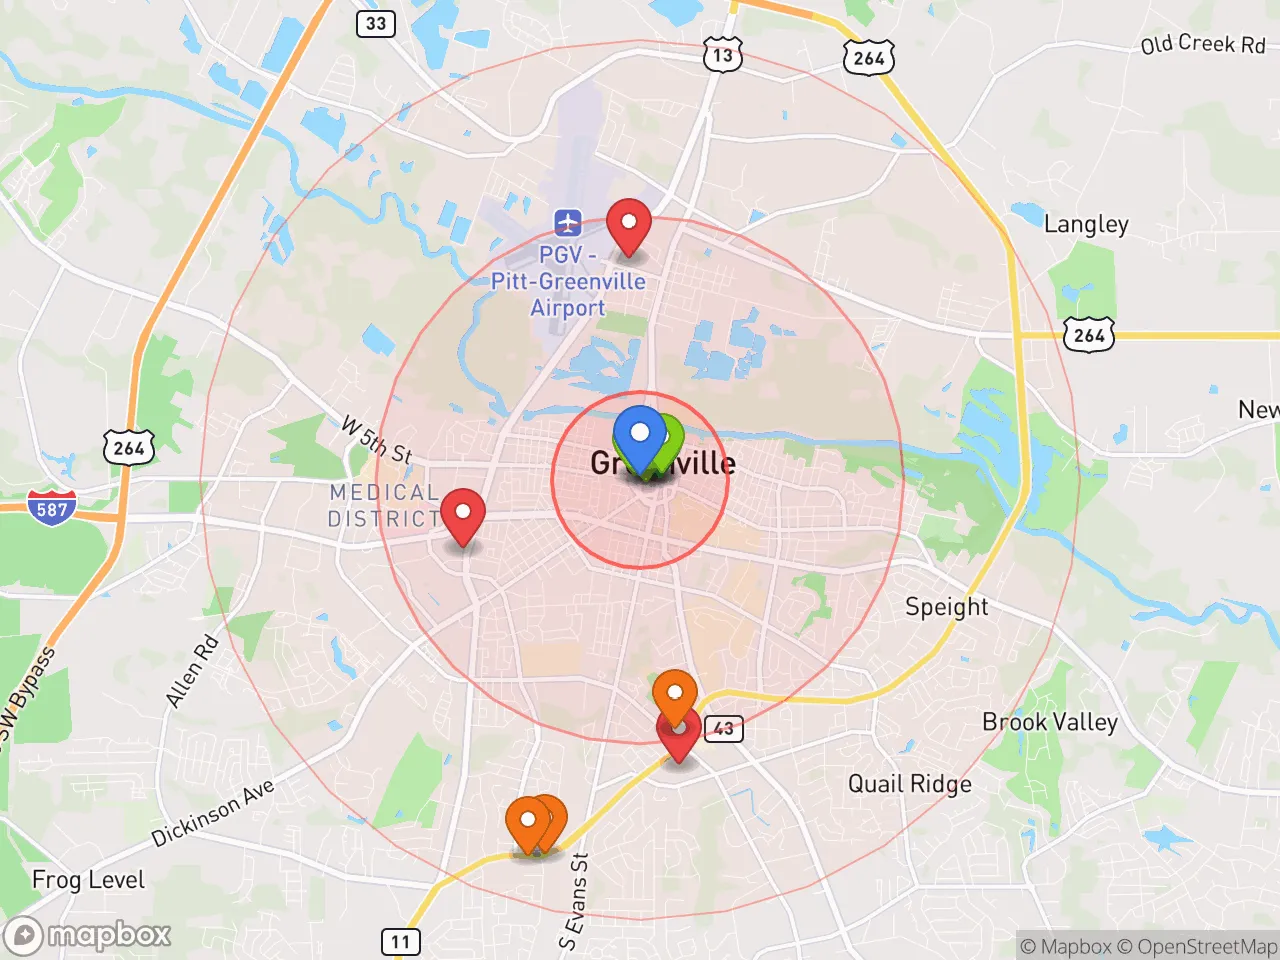
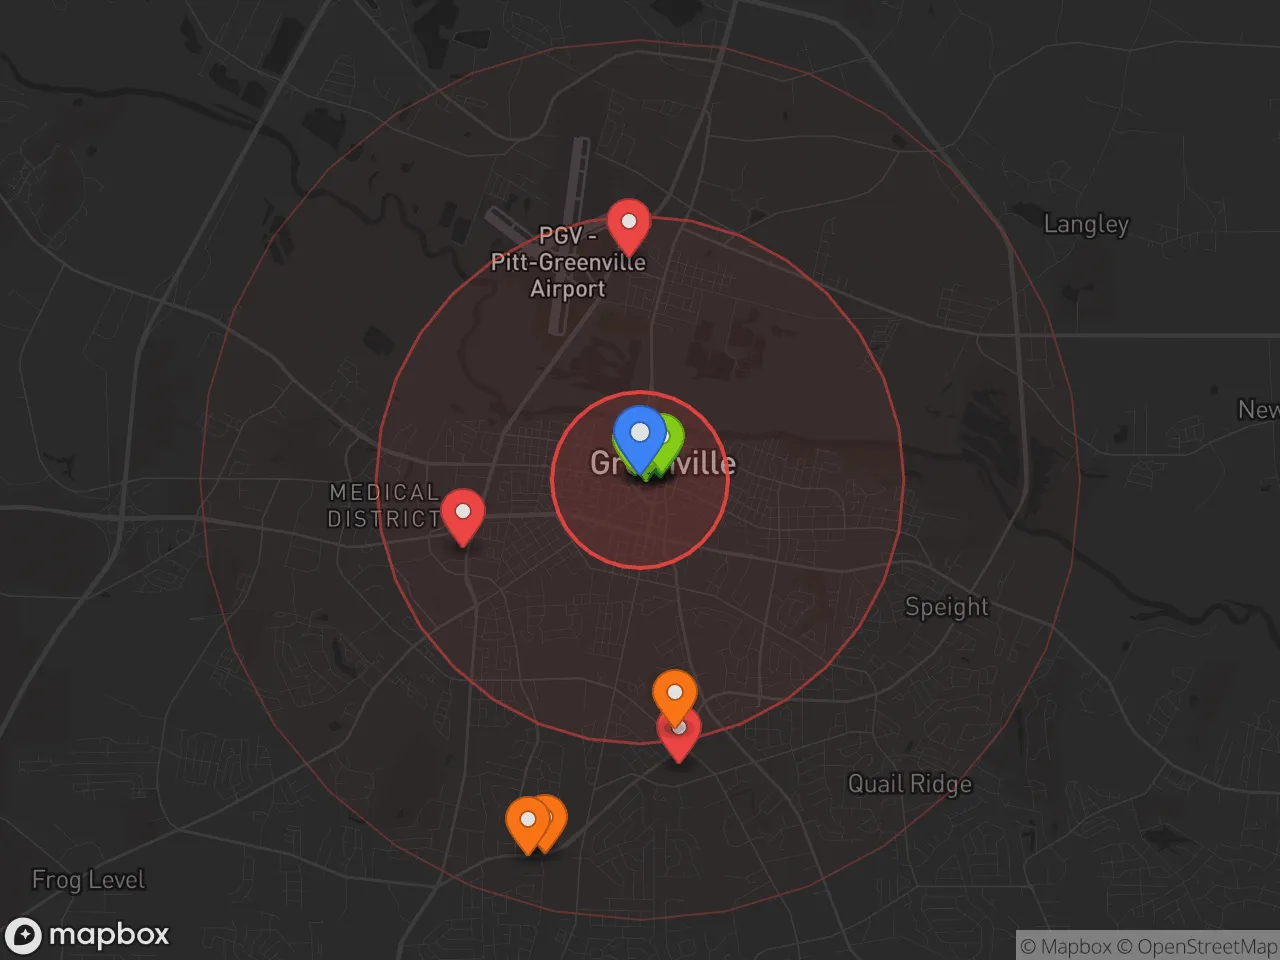
Explore the areaGroceries
7 within 10 miles
Gas
20 within 10 miles
Hospital
5 within 20 miles
Airport
RDU — Raleigh–Durham International
Post Office
USPS — Greenville, NC
Critical Amenities
Affluence Level in Greenville, North Carolina
A below-average socioeconomic profile. Incomes, home values, and educational attainment trail the U.S., with higher poverty and unemployment.
Crime in Greenville, North Carolina
Higher crime rates than 61% of comparable U.S. locations.
Violent CrimeViolent Crime Analysis
Property CrimeProperty Crime Analysis
Political Climate in Greenville, North Carolina
District shown is the primary district for this city’s centroid. Cities may span multiple districts.
Personal Sovereignty in Greenville, North Carolina
What does Personal Sovereignty tell us?
Personal Sovereignty measures your capacity for self-reliance and independence with minimal government friction. Higher scores mean fewer barriers between you and the way you want to live... but it assumes you have the space you need and good neighbors.
Personal Sovereignty measures your capacity for self-reliance and independence with minimal government friction. Higher scores mean fewer barriers between you and the way you want to live... but it assumes you have the space you need and good neighbors.
Viable for self-reliance. Generally workable, though some barriers may limit total independence.
State Policy
Energy independence: Importer (15% of energy produced in-state)
Personal Liberty
Homesteading
Strategic Assessment of Greenville, North Carolina
What does the Strategic Assessment tell us?
Strategic Assessment grades tactical survivability using Joel Skousen's Strategic Relocation framework. Major population centers, blast zones, natural disasters, and border exposure all drive risk — lower exposure means a more defensible position in a crisis.
Learn more about Strategic Relocation ($)Strategic Assessment grades tactical survivability using Joel Skousen's Strategic Relocation framework. Major population centers, blast zones, natural disasters, and border exposure all drive risk — lower exposure means a more defensible position in a crisis.
Learn more about Strategic Relocation ($)Meaningful friction. Expect exposure to either population pressure, blast zones, or natural disaster risk. Consider buying a retreat property.
Strategic Pillars
Key Distances
* Values derived from national, state, county, city and local statistics and may differ in a specific area. Last updated: 2026-04-21T15:14:21.000Z